There is a moment that every new private markets investor experiences, usually somewhere between twelve and eighteen months after committing capital to their first private equity fund. They open their quarterly statement, look at the performance line, and see a number that is negative. They committed capital with the expectation of superior long-term returns. What they received, at least on paper, looks like a loss.
This moment has ended more private market allocations than any market downturn. Not because the fund is failing. Not because the manager made a mistake. But because the investor did not understand what they were looking at. What they are looking at is the J-curve. And understanding it is not optional for anyone who wants to build a portfolio that captures the illiquidity premium over time.
What the J-curve actually is
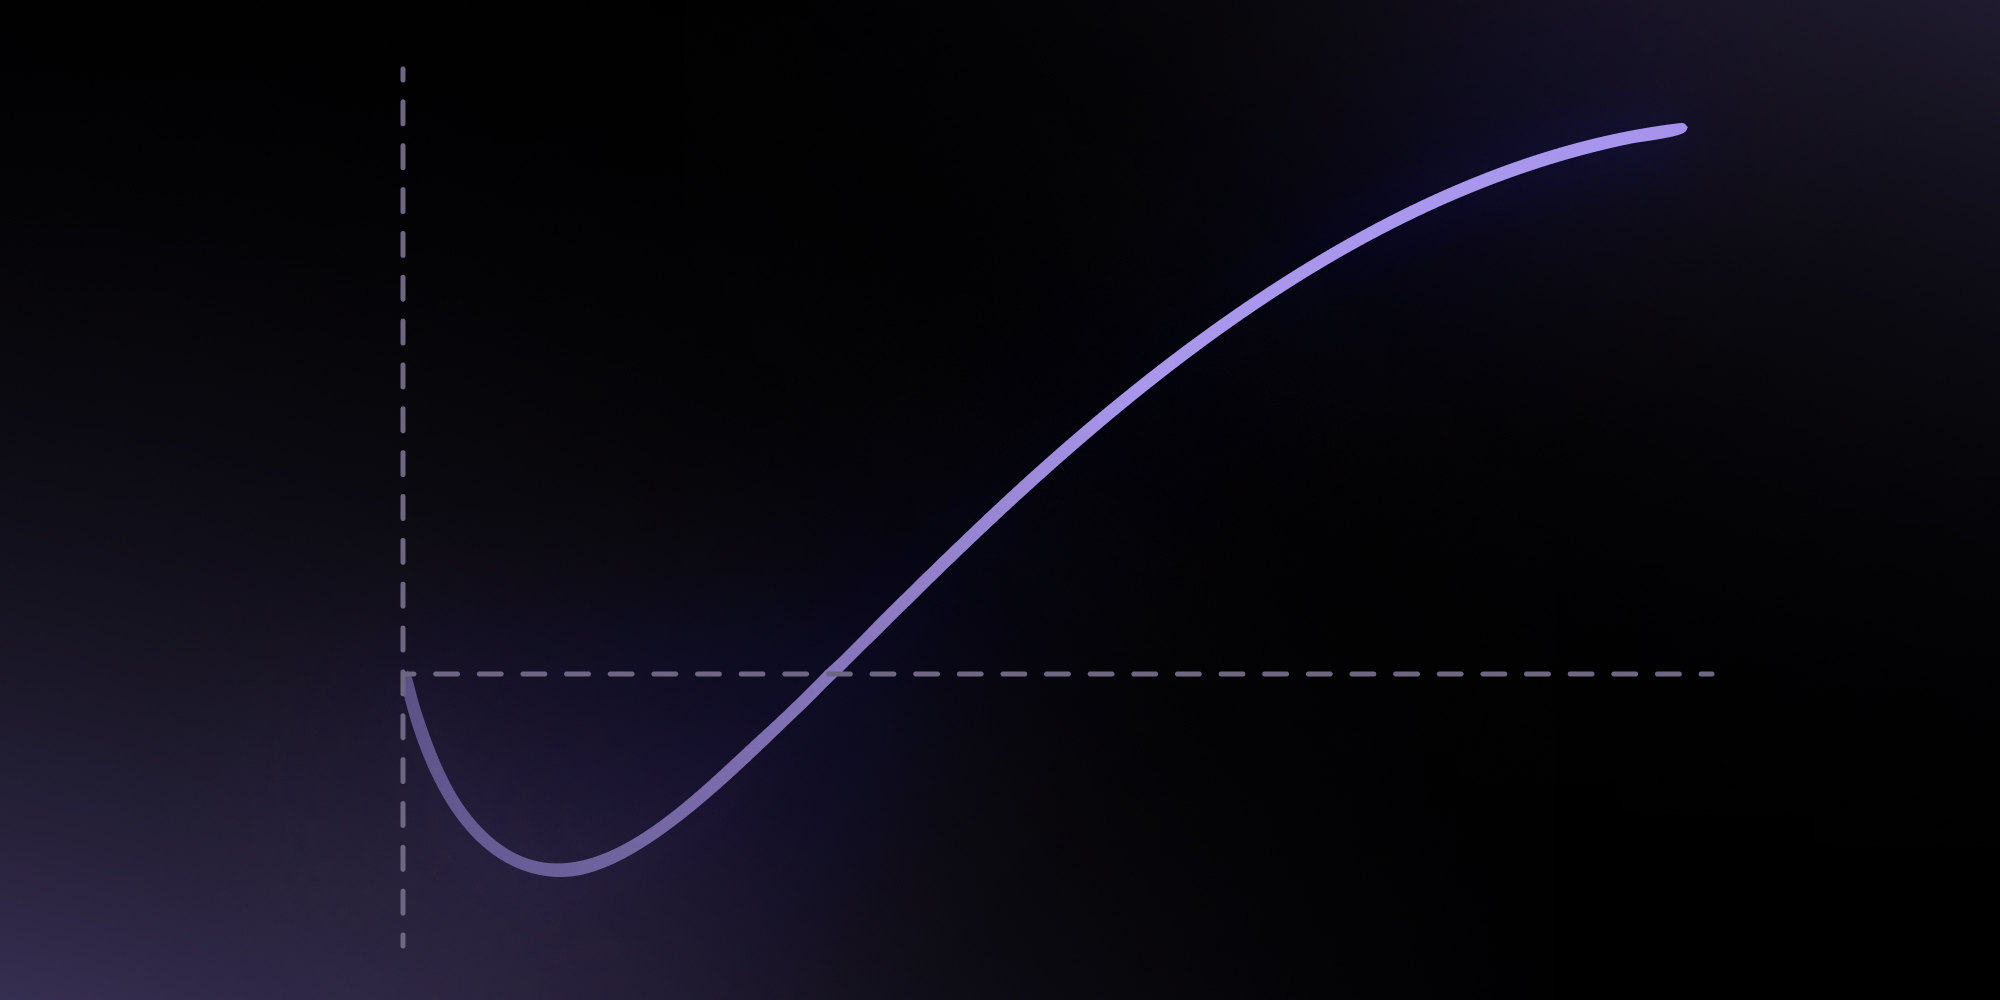
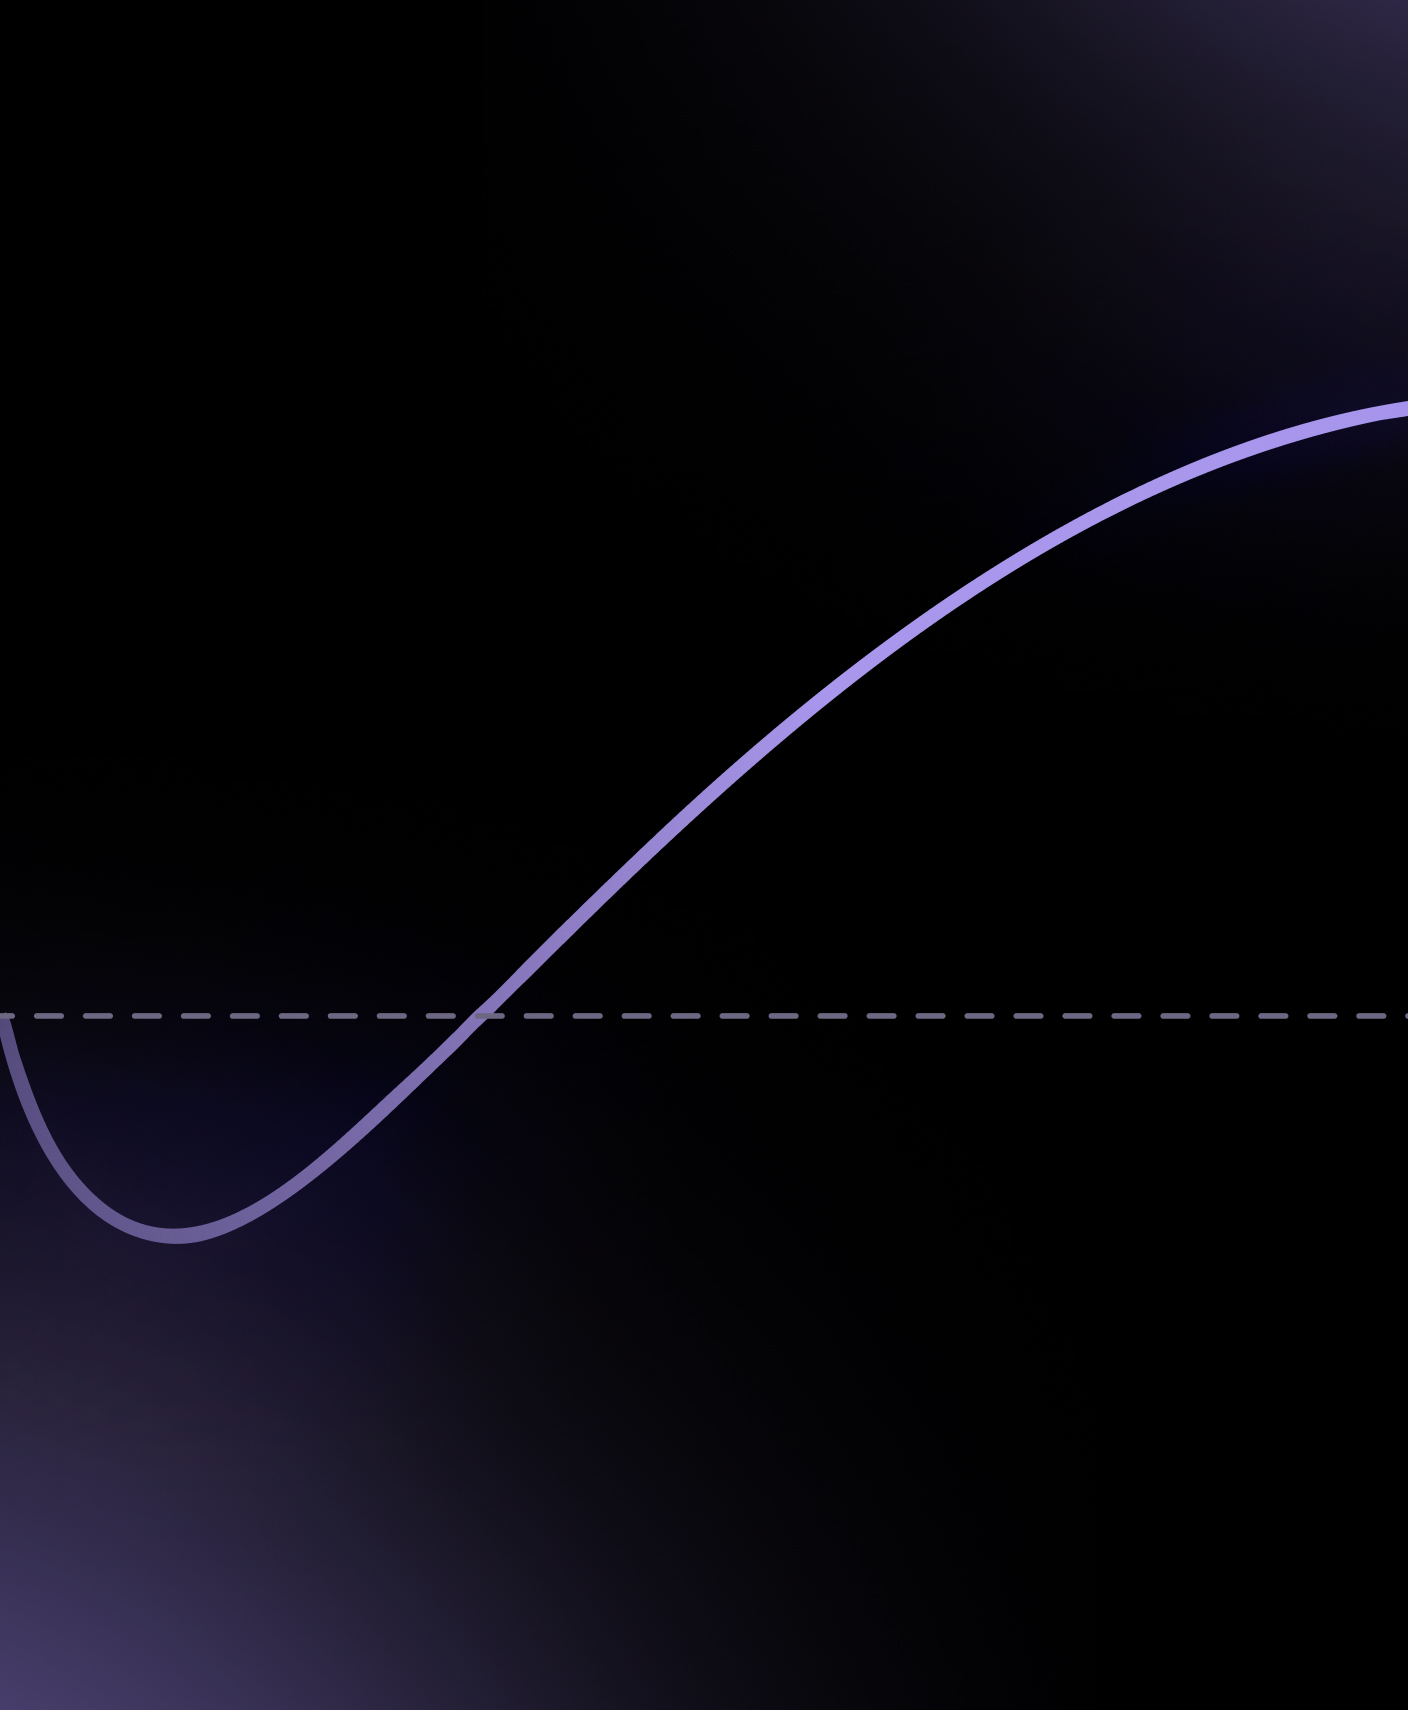
The J-curve earns its name from its shape: an initial descent into negative territory, followed by a gradual inflection and then a meaningful climb into positive returns. The descent is structural, driven by three forces that operate simultaneously in the early years of every fund.
First, management fees. A typical private equity fund charges approximately 2% annually on committed capital from day one, before a single acquisition has been made and before any value has been created to offset the cost. Second, accounting convention. When a fund acquires a company, it records the investment at cost. No upward revaluation occurs until the manager can demonstrate tangible value creation through operational improvements, revenue growth and margin expansion. That process takes time. Third, the deployment gap. Capital is committed upfront but invested gradually over three to five years. During this period, a significant portion of the commitment earns modest returns while fees accumulate. The reported net asset value falls. The IRR turns negative. The statement the investor receives reflects this reality accurately, and that accuracy is precisely what unsettles investors who expected something different.
Not all J-curves are equal
The shape, depth, and duration of the J-curve varies significantly depending on the strategy. Buyout funds, which acquire established companies with proven cash flows, tend to produce the shallowest and shortest curves. Value creation can begin quickly, and exits can occur as early as year three or four. Venture capital produces the deepest and longest curves. Early-stage companies require years to develop products, acquire customers, and reach exit scale. More than 60% of VC funds from the 2019 vintage had not distributed any capital back to limited partners after five years, according to Carta's 2024 analysis. Private credit largely avoids the problem entirely. Loans generate income from the moment capital is deployed, producing a fundamentally different cash flow profile from the first month of the fund's life.
Why it feels worse than it is
The J-curve is not merely a financial phenomenon. It is a psychological one. Public markets provide daily pricing. Every morning, an investor can see what their portfolio is worth and act on the information. Private markets invert this dynamic. A negative number in year two typically means everything is proceeding exactly as expected. The challenge is that this distinction is counterintuitive, and the investor who does not understand it is vulnerable to abandoning the allocation at precisely the wrong moment, before the value creation phase has had time to produce the returns that justify the initial patience.
How to manage it
The J-curve cannot be eliminated but it can be managed. Vintage diversification is the most reliable tool. A portfolio committed across three consecutive vintage years carries materially lower performance risk than one concentrated in a single year, because distributions from a maturing fund help fund the capital calls of a newer one. The portfolio develops a self-sustaining cash flow structure that smooths both the capital call burden and the reported performance volatility.
Secondary investments provide another lever. Acquiring existing fund interests from other investors rather than committing to a new fund gives exposure to portfolios already past the trough, often purchased at a discount to net asset value. Secondary transaction volume reached 160 billion dollars in 2024, reflecting growing institutional recognition of this structural advantage. Co-investment, deploying capital directly into a specific transaction alongside a fund manager, allows immediate exposure to an asset already in the value creation phase, with no deployment period waiting and often no management fees on the co-invested capital.
The bottom line.
The J-curve exists for the same reason the illiquidity premium exists. It is structural compensation for accepting something most investors are unwilling to accept. The investors who have systematically captured private equity returns over decades did not do so by avoiding the J-curve. They did so by understanding it well enough to hold through it, committing capital across vintages so that the trough was never the dominant feature of their portfolio, and using the full ten-year fund cycle as the relevant measurement period rather than the quarterly statement. The J-curve is not a flaw in private markets investing. It is the price of admission. And for investors who can pay it with their eyes open, the terminal value of the J has historically been well worth the depth of its initial descent.